Please upgrade your web browser now. Internet Explorer 6 is no longer supported.>

Top 10 Carbon Steel Plate Manufacturers Worldwide

Carbon steel plate remains a practical foundation for bridges, pressure vessels, shipyards, heavy machinery, and energy infrastructure. Its appeal is direct: strength, weldability, availability, and comparatively predictable pricing. Yet choosing among Carbon Steel Plate Manufacturers requires more than comparing annual output or advertised prices.

The World Steel Association reported approximately 1.89 billion tonnes of crude steel production worldwide in 2023. Its 2024 Short Range Outlook also showed how construction demand, manufacturing activity, and regional economic conditions continue shaping steel markets. These figures describe crude steel, not finished plate. That distinction matters. A large producer may not offer the thickness, grade, heat treatment, or certification required for a specific project.

Quality is visible in details. Consider mill certificates, ultrasonic testing, dimensional tolerances, surface condition, and traceability from heat number to shipment. The IEA’s Iron and Steel Technology Roadmap also highlights emissions reduction as a major industry challenge. Production volume alone is no longer enough.

Edwin Basson, Director General of the World Steel Association, has described steel as “essential to modern life.” That observation remains relevant, though it does not answer every purchasing question. Delivery reliability, technical support, and transparent documentation can matter more than a polished ranking.

This guide examines ten leading manufacturers worldwide through those practical measures. The list is informative, not absolute. Regional access, product scope, and changing market conditions may alter the outcome. Readers should verify current certifications, plant capabilities, and commercial terms before making a final decision.
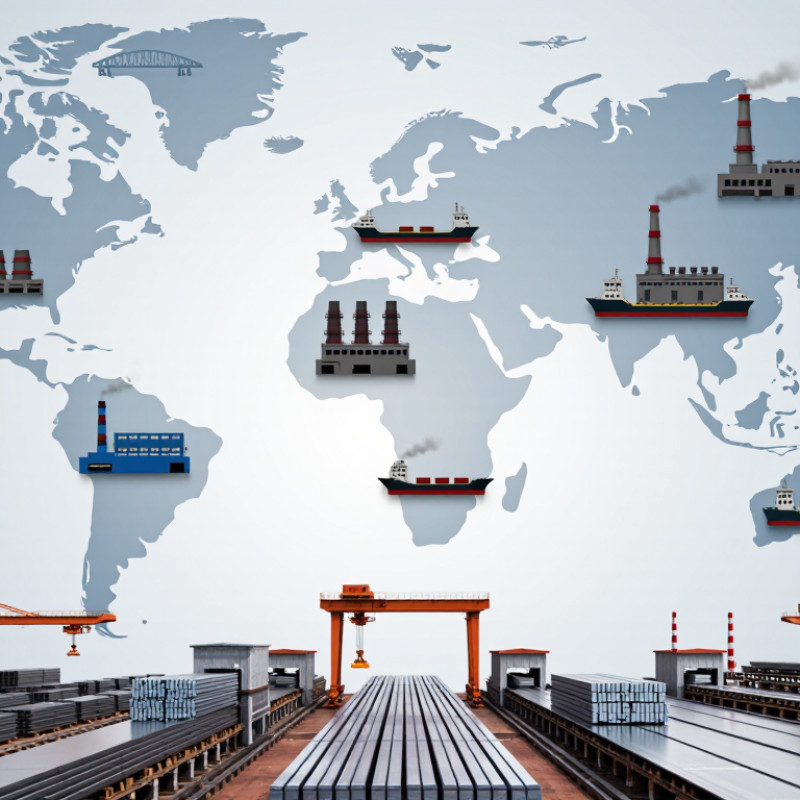
Top 10 Carbon Steel Plate Manufacturers Worldwide

Carbon Steel Plate Industry Overview: 1.89 Billion Tonnes of Steel in 2023

Carbon Steel Plate Industry Overview: 1.89 Billion Tonnes of Steel in 2023

Global steelmaking reached approximately 1.89 billion tonnes in 2023, according to the World Steel Association’s World Steel in Figures 2024. This figure represents crude steel, not carbon steel plate alone. Still, it shows the enormous industrial base supporting plate production, from shipyards to bridges and pressure equipment.

Carbon steel plates begin with slabs, reheating furnaces, and controlled rolling. Their final performance depends on thickness, chemistry, cooling speed, and inspection discipline. The OECD Steel Outlook highlights persistent overcapacity concerns and uneven demand across major markets. That pressure can influence mill utilization, delivery schedules, and export pricing.

Quality is more than a polished certificate. Buyers should review heat numbers, ultrasonic testing records, tensile results, and impact-test temperatures. A plate may look flawless under warehouse lighting. It can still fail a specification review. ASTM, EN, and ISO requirements offer useful frameworks, but documents must match the actual production heat. Traceability matters.

Energy use remains a difficult issue. The International Energy Agency identifies steel as one of the largest industrial sources of carbon dioxide emissions. Cleaner electricity, higher scrap use, and lower-emission production routes may reduce future impacts. Progress is uneven. That deserves scrutiny. For any global manufacturer ranking, output volume alone is an incomplete measure. Consistency, verified data, technical support, and responsible production should carry equal weight.

Ranking Criteria: Annual Output, Plate Capacity, Certifications, and Global Reach

Top 10 Carbon Steel Plate Manufacturers Worldwide

A credible ranking starts with annual output, but total crude steel is not plate production. The World Steel Association reported 1.892 billion tonnes of global crude steel output in 2023. That figure shows scale, not product specialization. Our ranking therefore weighs published plate capacity, rolling-line size, slab supply, and recent operating data. Capacity should be verified against annual reports, technical disclosures, and shipment records.

1.892 billion tonnes
global crude steel output in 2023

Certification adds another practical test. ISO 9001 supports quality control, while ISO 14001 indicates structured environmental management. Product approvals, inspection systems, and traceability matter more for pressure vessels, bridges, and heavy machinery. Global reach is measured through export destinations, port access, regional service centers, and delivery reliability. The OECD’s Steel Market Developments reports continuing worldwide excess capacity, so installed capacity alone can be misleading. Some mills list impressive capacity but operate well below it. That deserves scrutiny.

Tips: Compare saleable plate output, not crude steel output. Check thickness ranges, maximum plate width, and documented delivery performance. Request current mill certificates and third-party audit evidence. World Steel Association data is useful for market context, but it does not replace plant-level verification. A ranking can still contain gaps. Disclosure quality varies, and private production figures are sometimes incomplete. That uncertainty should remain visible rather than hidden behind precise-looking scores.

Top 10 Carbon Steel Plate Manufacturers by Production Scale and Market Coverage

A credible Top 10 ranking must measure more than advertised capacity. The World Steel Association reported global crude steel production of 1,892 million tonnes in 2023. That figure covers steelmaking, not finished carbon steel plate. The distinction matters. Production scale should combine crude output, plate-line capacity, utilization, and delivery consistency. Public filings and mill certificates provide stronger evidence than promotional claims. Still imperfect. Capacity may remain idle during maintenance or weak demand.

Market coverage requires more than export volume. UN Comtrade records under HS codes 7208, 7209, and 7211 help track relevant flat-rolled steel flows. OECD steel outlooks add useful context on excess capacity and regional demand. A manufacturer serving shipyards in Asia, infrastructure projects in Europe, and machinery buyers in North America shows broader reach. However, trade statistics can mix carbon, alloy, coated, and semi-finished products. Buyers should examine product-level data carefully.

For the ten leading producers, production scale could receive 60% of the score. Market coverage could receive 40%. Scale includes melting capacity, plate throughput, and stable monthly deliveries. Coverage includes regional warehouses, technical support, certifications, and shipment reliability. The weighting remains debatable. A huge mill with inconsistent lead times may support fewer projects than a smaller, responsive producer. Audited quality records and recent shipment histories make the ranking more defensible. Numbers alone can mislead.

Top 10 Carbon Steel Plate Manufacturers Worldwide - Top 10 Carbon Steel Plate Manufacturers by Production Scale and Market Coverage

Rank Anonymized Producer Parent-Group Crude Steel Output
2023 (Million Tonnes)
Carbon Steel Plate Capability Estimated Production-Scale Tier Geographic Market Coverage Export Market Reach Typical Plate Product Range
1 Producer 01 130.77 Integrated flat-steel and heavy-plate operations Very Large Domestic, regional, and global High Structural, shipbuilding, pressure-vessel, and line-pipe plate
2 Producer 02 68.52 Multiple flat-steel and plate production sites Very Large Europe, North America, South America, and selected Asian markets High Structural, automotive-grade, energy, and wear-resistant plate
3 Producer 03 55.89 Large integrated plate and flat-products capacity Very Large Domestic and international markets High Shipbuilding, bridges, machinery, and structural plate
4 Producer 04 43.64 Advanced flat-steel and specialty plate facilities Large East Asia, North America, Southeast Asia, and Europe High High-strength, construction, energy, and industrial plate
5 Producer 05 41.34 Integrated steelmaking with broad flat-product capability Large Domestic, Asian, Middle Eastern, and African markets Moderate to High Structural, pressure-vessel, pipeline, and ship plate
6 Producer 06 40.54 Large-scale carbon steel and heavy-plate production Large Domestic and Asia-Pacific markets Moderate to High General engineering, construction, shipbuilding, and machinery plate
7 Producer 07 39.23 Integrated flat products and project-oriented plate supply Large Domestic, Southeast Asian, and selected export markets Moderate Construction, infrastructure, machinery, and wear-resistant plate
8 Producer 08 33.65 Flat-steel, heavy-plate, and engineered steel products Large Domestic, Asian, Middle Eastern, and African markets Moderate to High Bridge, shipbuilding, pressure-vessel, and structural plate
9 Producer 09 29.48 Flat-steel and plate production across several regions Upper-Medium India, Europe, Southeast Asia, and selected global markets High Construction, line-pipe, energy, and industrial plate
10 Producer 10 26.15 Integrated steelmaking with growing plate capacity Upper-Medium India, North America, Europe, and selected export markets High Structural, infrastructure, energy, and heavy-engineering plate

Note: Company identities are intentionally anonymized. The production figures represent publicly reported parent-group crude steel output for 2023 rather than standalone carbon steel plate output, because most manufacturers do not separately disclose plate production volumes. Market-coverage and product-capability categories summarize publicly documented operating footprints and product portfolios.

Regional Comparison: Asia, Europe, North America, and Emerging Steel Markets

Regional capability matters when comparing the top 10 Carbon Steel Plate Manufacturers worldwide. Asia often leads in production scale, competitive pricing, and export capacity. Large mills can roll plates from 6 to 300 millimeters thick. Many serve construction, shipbuilding, and heavy machinery markets. However, delivery times may change sharply during port congestion or raw material disruptions.

European producers generally emphasize advanced grades, energy efficiency, and strict traceability. Their documentation often includes heat numbers, impact-test results, and ultrasonic inspection records. This supports demanding infrastructure and pressure equipment projects. Costs are usually higher. Yet buyers may receive stronger technical support and more predictable quality control. The difference is not always clear on paper.

North American manufacturers benefit from regional supply chains and established certification systems. They often compete through reliable delivery, customized dimensions, and close customer service. Emerging steel markets are expanding modern rolling lines and improving laboratory testing. They may offer attractive prices and shorter routes to nearby buyers. Still, buyers should verify production history, inspection independence, and mill certificate accuracy. A low quotation can hide extra testing, inland freight, or import duties. No region wins every category. This comparison also remains imperfect because plant performance changes with investment, energy prices, and local demand. A serious sourcing decision should review recent test reports, plate tolerances, minimum order quantities, and actual shipment records. Small details matter.

Key Product Data: Grades, Thickness Ranges, Standards, and End-Use Sectors

A useful review of the top 10 carbon steel plate manufacturers should begin with product data, not production volume. Common grades include ASTM A36 for general fabrication, ASTM A572 for higher-strength structures, and ASTM A516 for pressure vessels. European buyers may specify S235JR, S275JR, or S355JR under EN 10025. JIS SS400 remains common in Asian supply chains.

Thickness ranges often start near 3 mm and extend beyond 200 mm, depending on the mill, grade, and rolling route. Heavy plates may require normalized rolling, quenching and tempering, or controlled cooling. These treatments affect strength, weldability, and impact performance. Standards also define chemistry, tensile properties, bend tests, and dimensional tolerances. Do not trust a range without checking the actual mill certificate.

End-use sectors reveal whether the product data is practical. Shipbuilding needs reliable weldability and impact toughness. Construction projects often prioritize yield strength, flatness, and cutting performance. Energy equipment may require ultrasonic testing, low-temperature impact tests, and strict traceability. A heat number should follow the plate from production to delivery. That detail matters.

A polished comparison table can still mislead. Thickness availability changes with width, order volume, and delivery region. Certificates may meet a standard while missing a project-specific requirement. I would verify the latest test report, inspection level, surface condition, and tolerances before approving any supplier. Small details decide whether a plate performs well in the field.

Top 10 Carbon Steel Plate Manufacturers Worldwide — Key Product Data

The chart compares ten widely specified carbon and low-alloy structural or pressure-vessel plate grades used by global producers. Values represent minimum yield strength stated by the relevant specifications; actual thickness availability varies by mill, heat treatment, and certification.

Grade / Specification Typical Thickness Range Primary End-Use Sectors
ASTM A366–200 mmBuildings, bridges, general fabrication, machinery
ASTM A572 Grade 506–150 mmStructural frames, bridges, transport equipment
ASTM A516 Grade 606–205 mmPressure vessels, boilers, storage tanks
ASTM A516 Grade 706–205 mmPressure vessels, petrochemical and process equipment
EN 10025 S235JR3–400 mmConstruction, structural steelwork, general engineering
EN 10025 S355JR3–400 mmHeavy construction, bridges, cranes, machinery
JIS G3101 SS4006–200 mmBuildings, industrial equipment, welded structures
GB/T 700 Q235B4–200 mmConstruction, general fabrication, machinery
GB/T 1591 Q355B4–200 mmBridges, buildings, heavy equipment, transport
AS/NZS 3678-2506–200 mmStructural steelwork, infrastructure, fabrication

Reference framework: ASTM A36, ASTM A572, ASTM A516, EN 10025, JIS G3101, GB/T 700, GB/T 1591, and AS/NZS 3678. Thickness ranges are representative commercial product ranges rather than universal specification limits.